AutoFE Operator
Operator List
Basic Operator
f represents the numerical features, and c represents the category features.
-
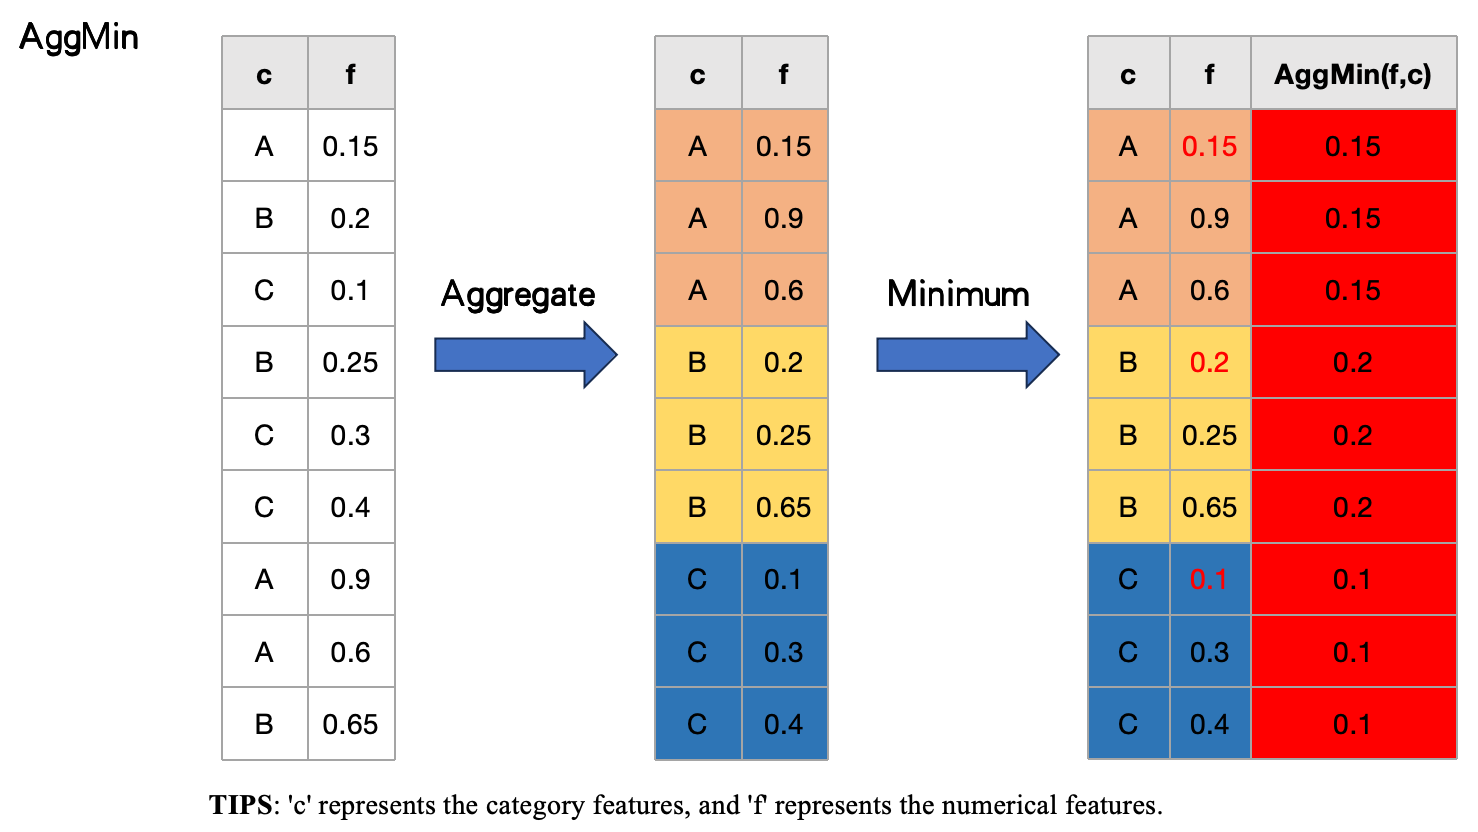
AggMin(f, c): the minimum value offin each category of featurec. -
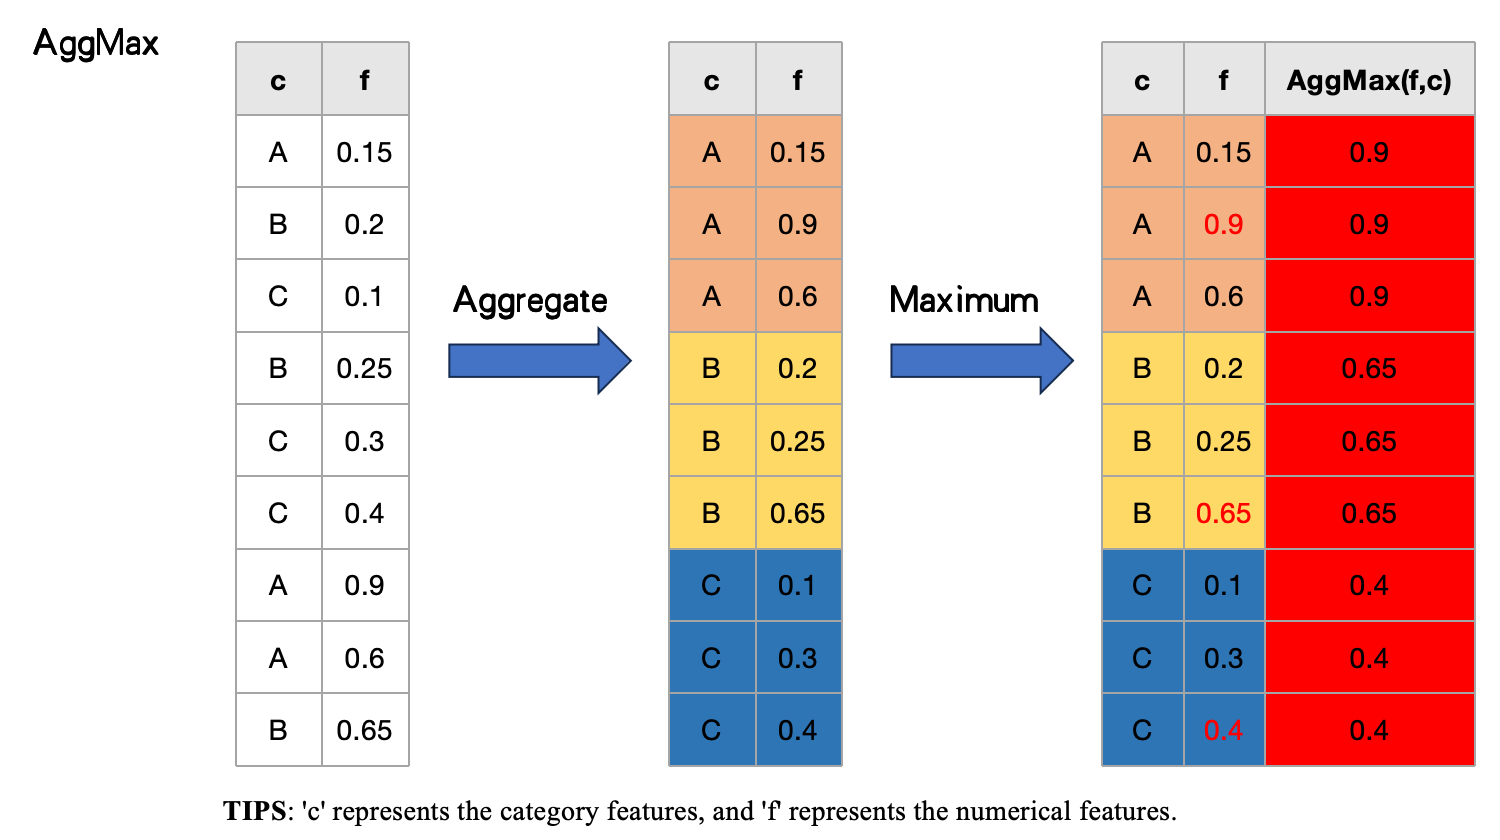
AggMax(f, c): the maximum value offin each category of characteristicc. -
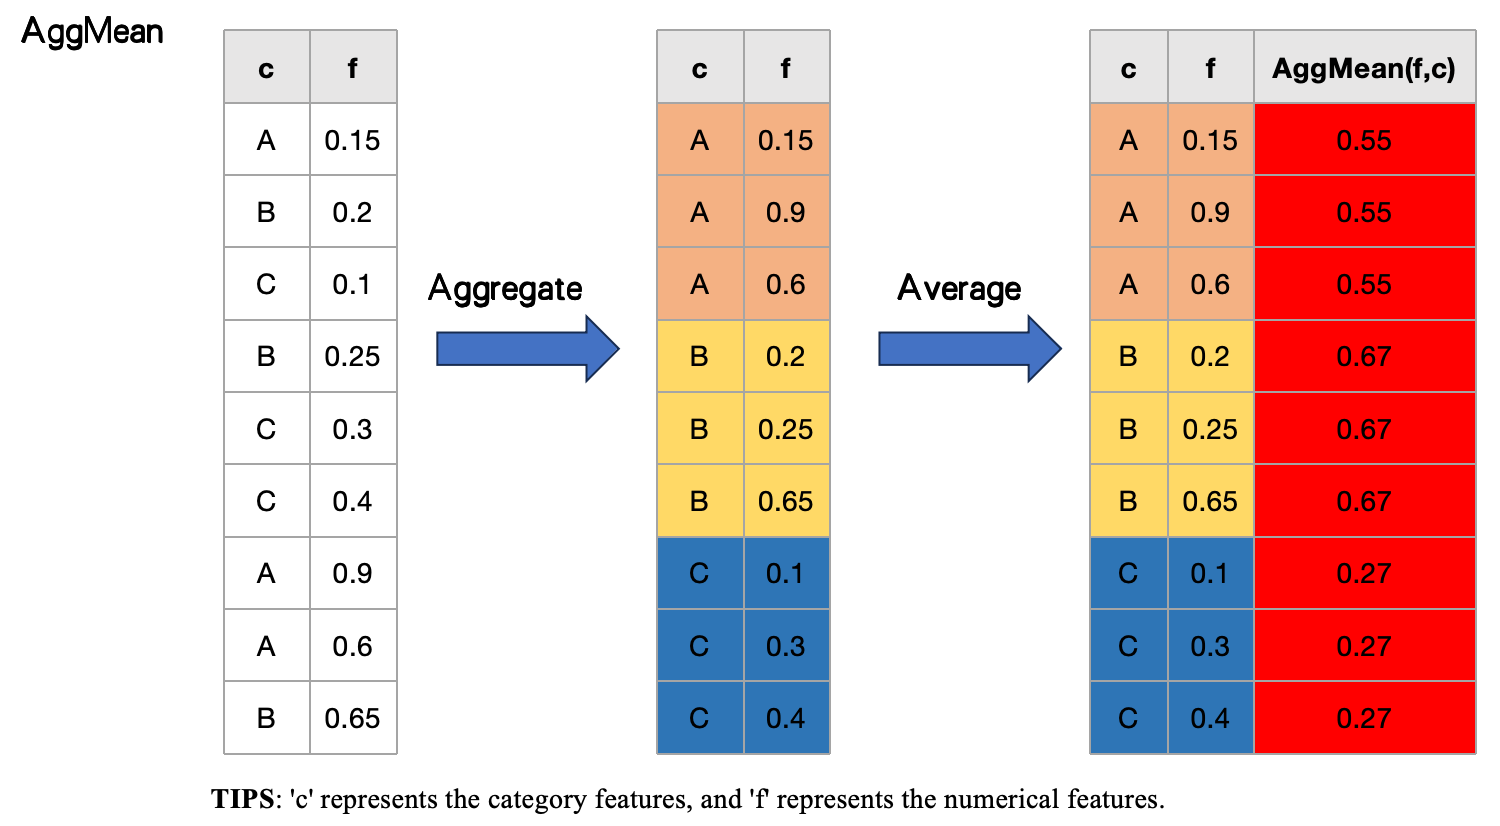
AggMean(f, c): the average value offin characteristicccategories. -
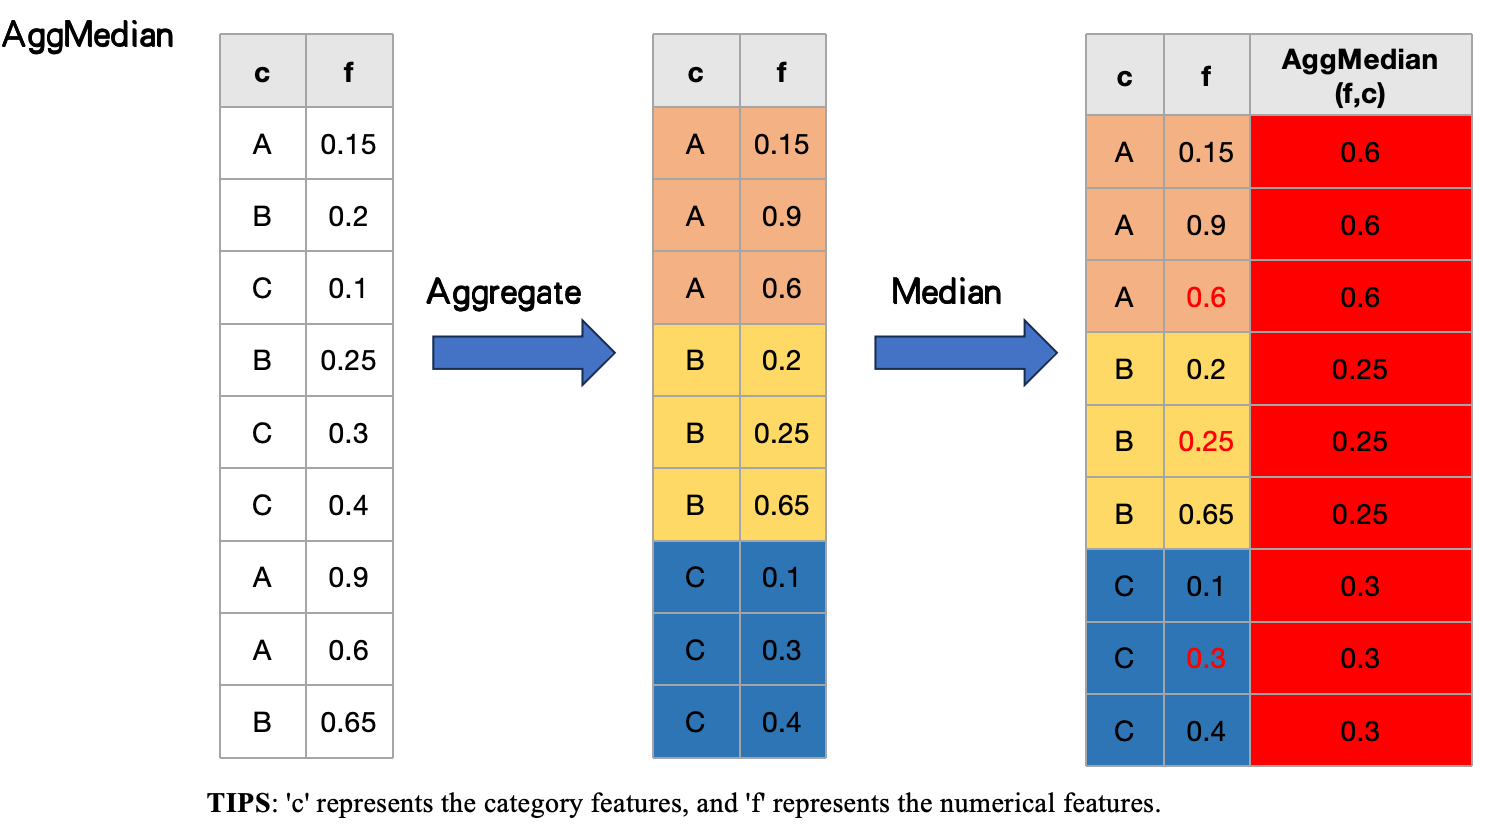
AggMedian(f, c): the median offin characteristicccategories. -
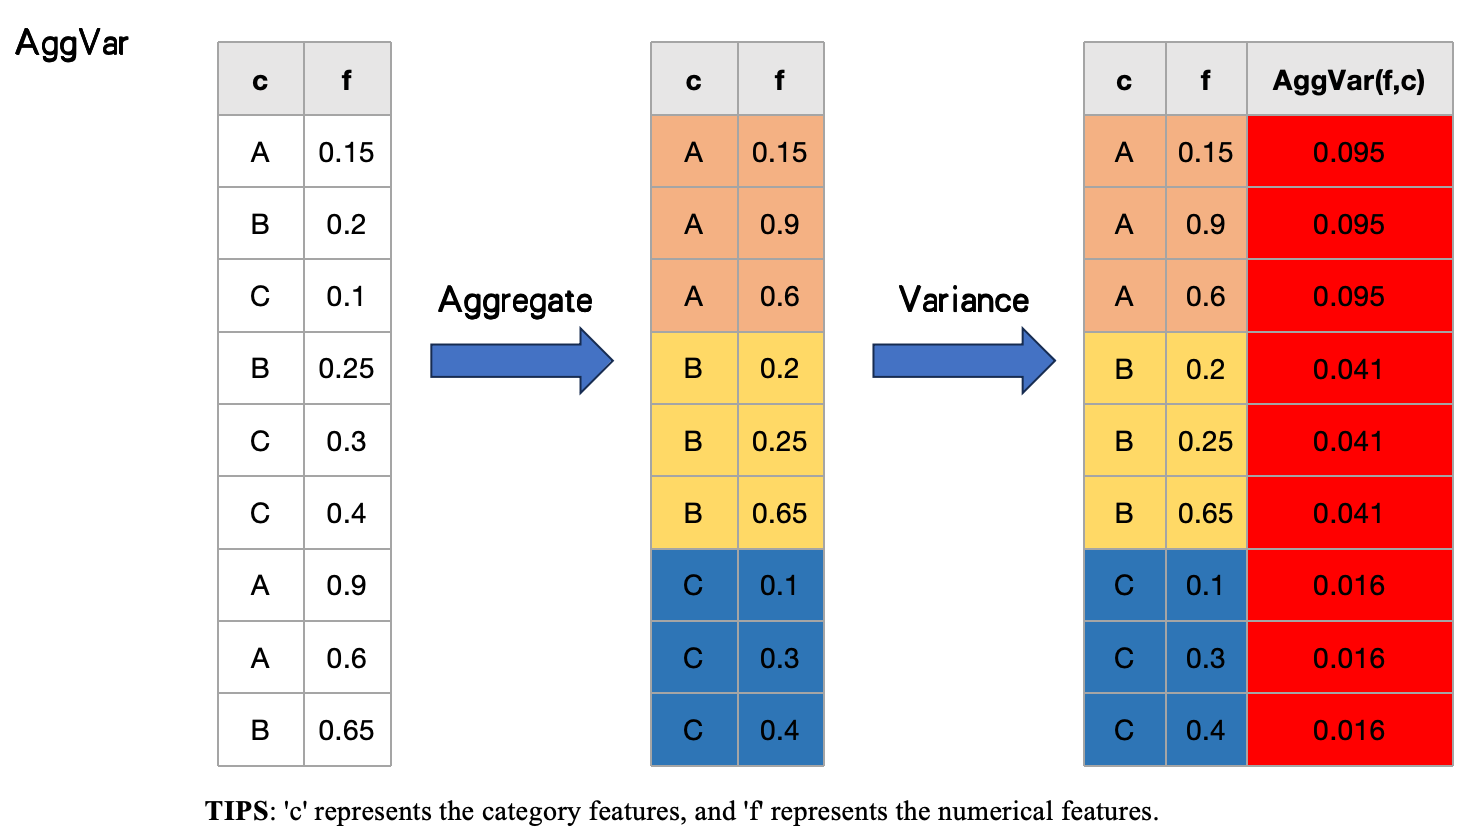
AggVar(f, c): variance offin characteristicccategories. -
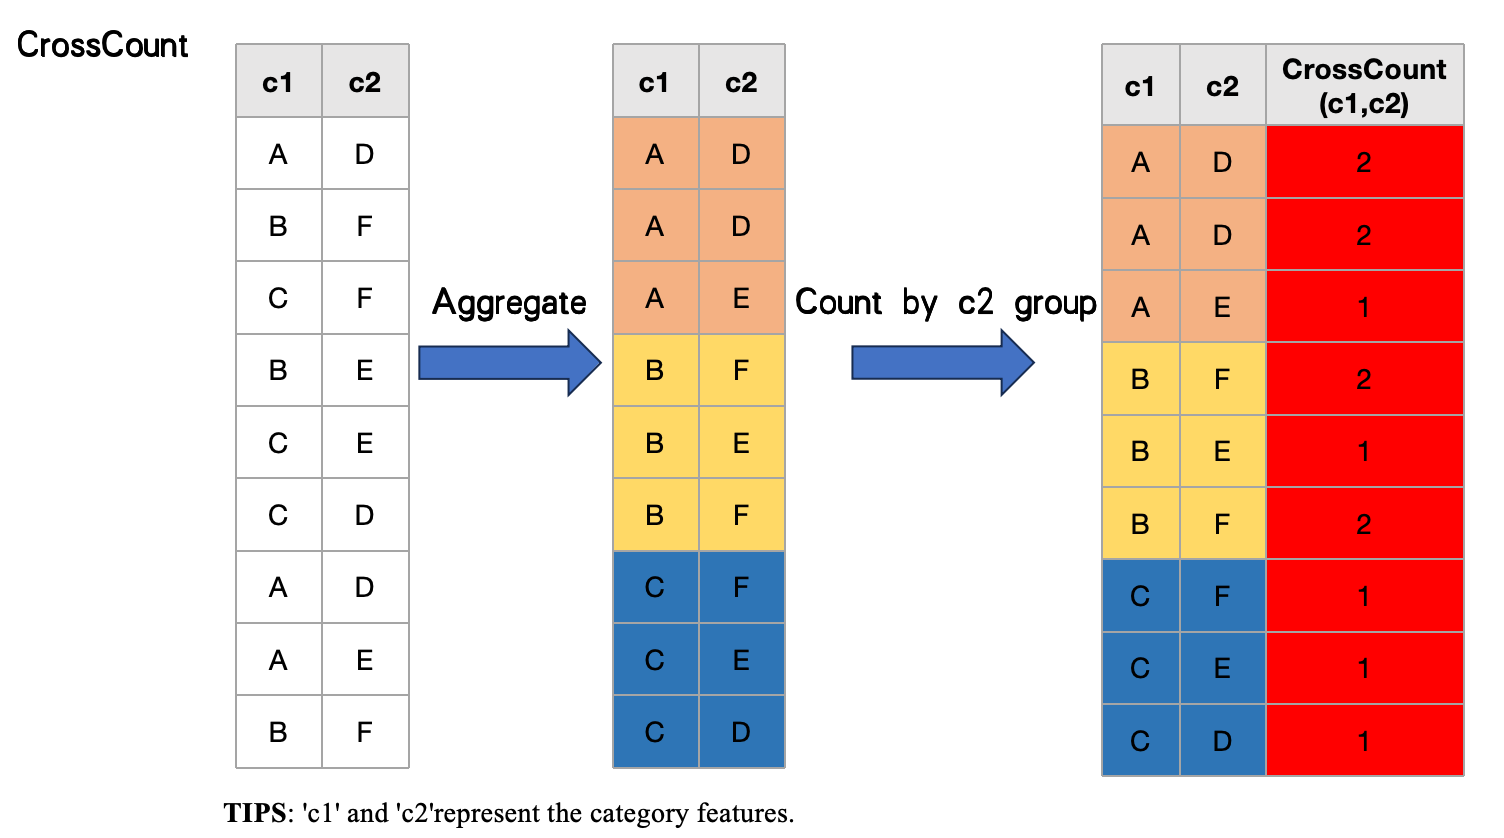
CrossCount([c1, c2, ..]): based on the count of characteristiclistaggregates, thelistlength is greater than or equal to 2. -
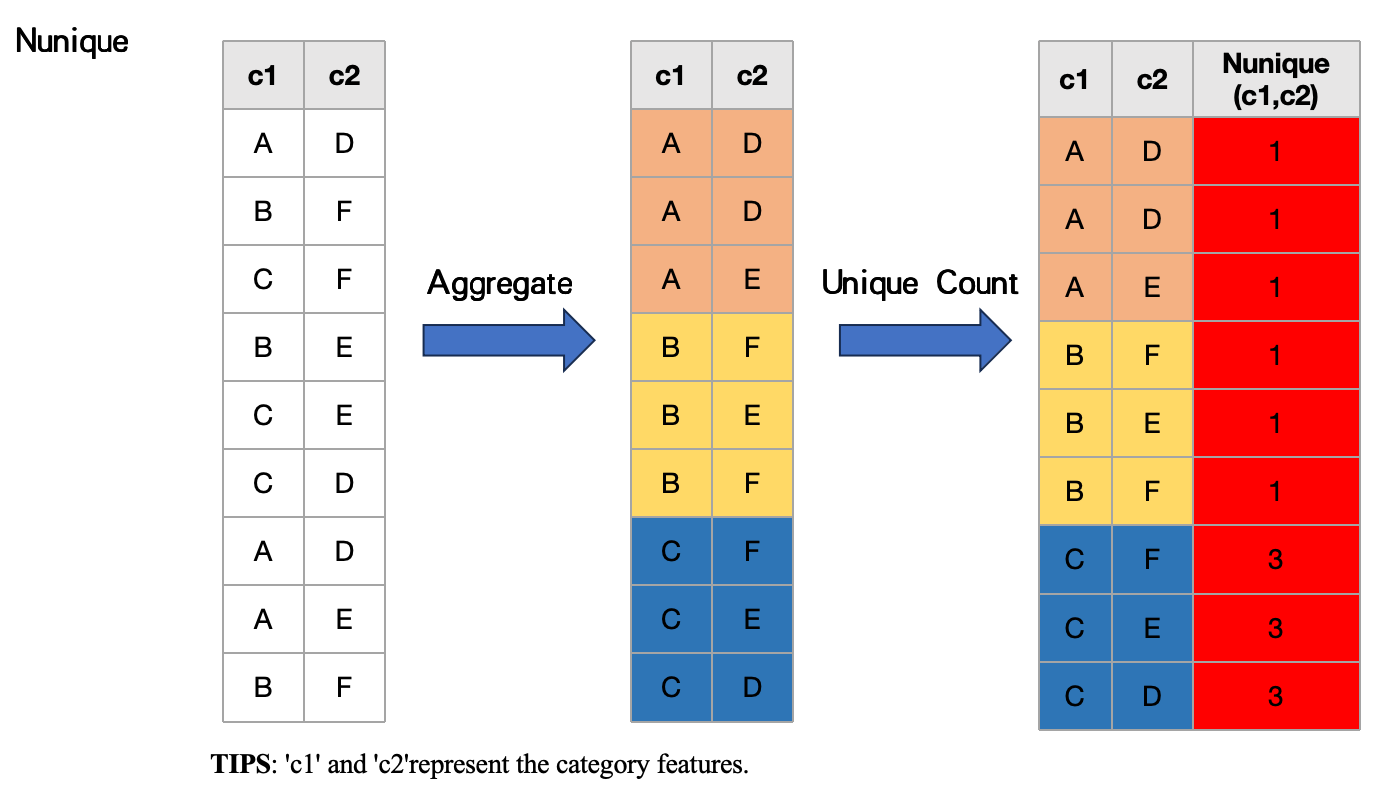
Nunique(c1, c2): count of unique values ofc1in featurec2categories. -
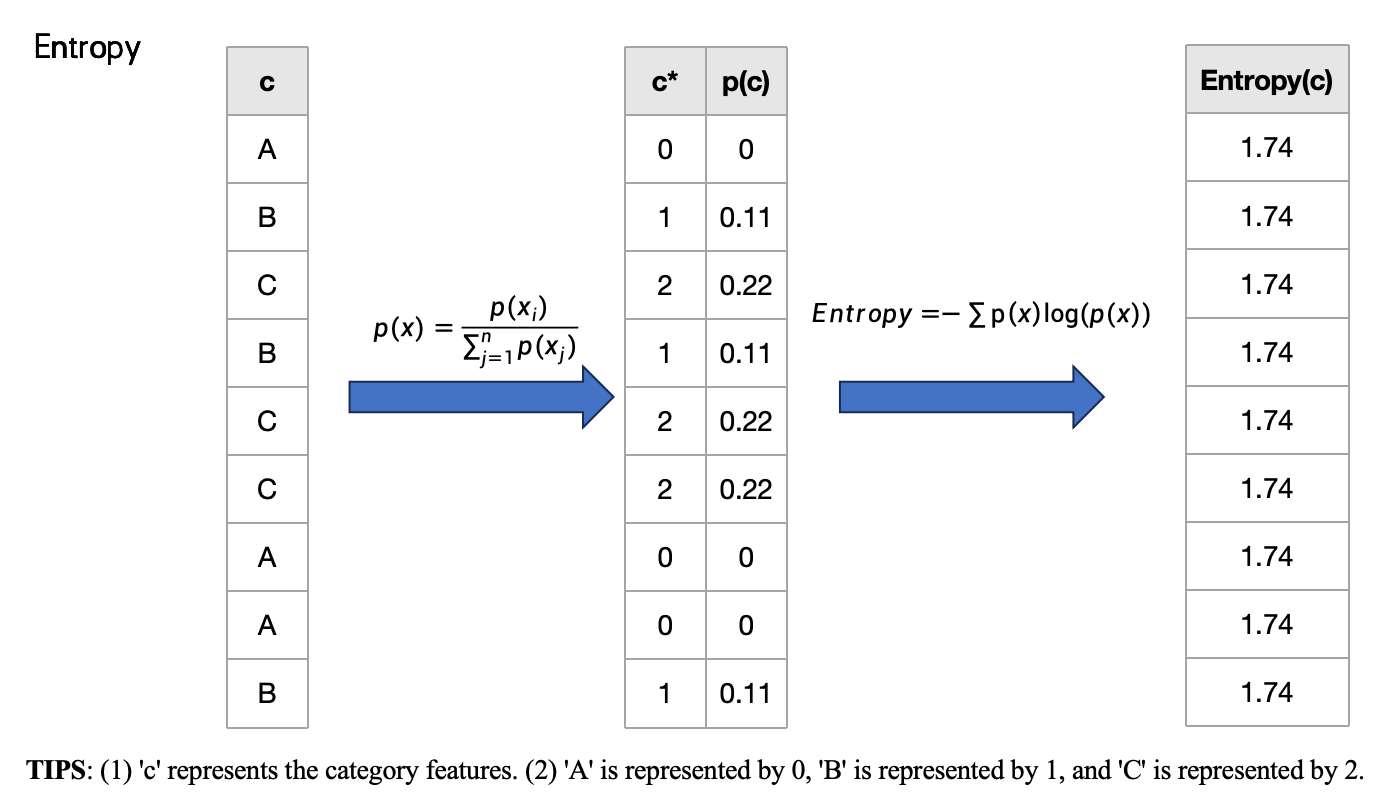
Entropy(c): entropy of each category of featurec. -
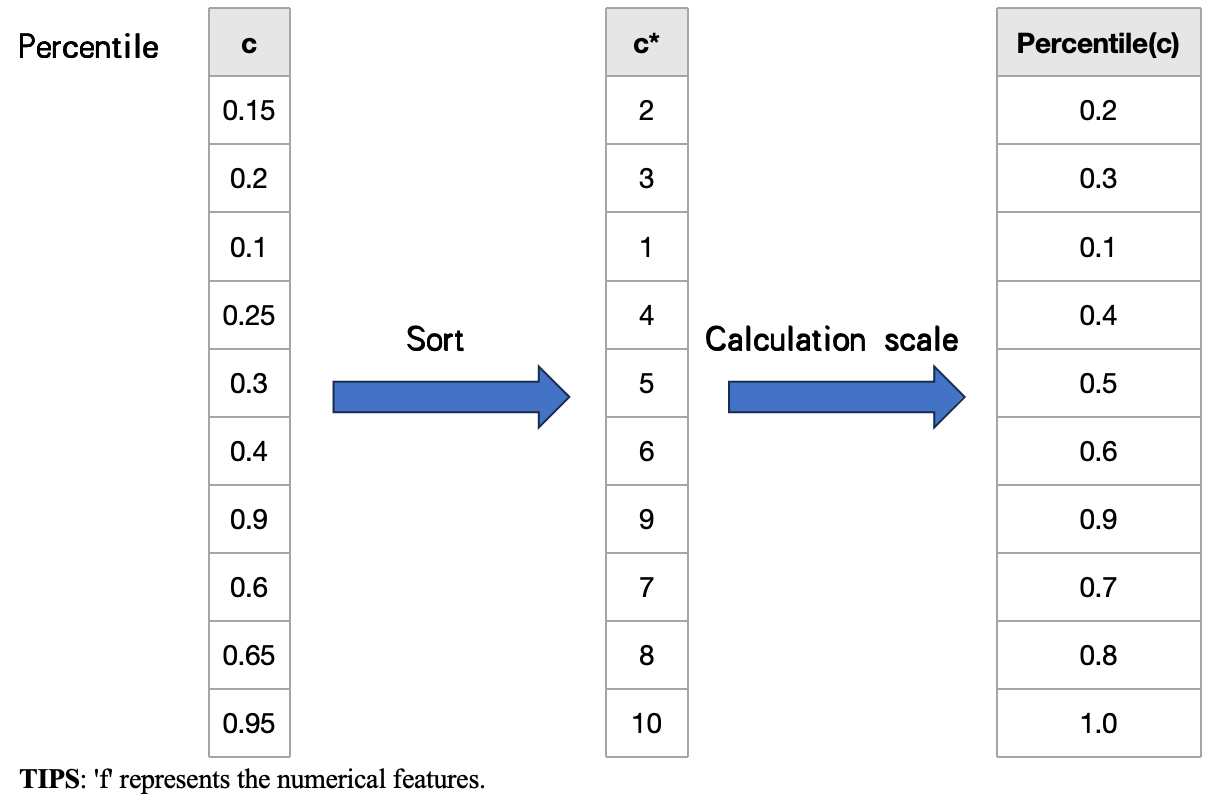
Percentile(f): featurefpercentile of each data. -
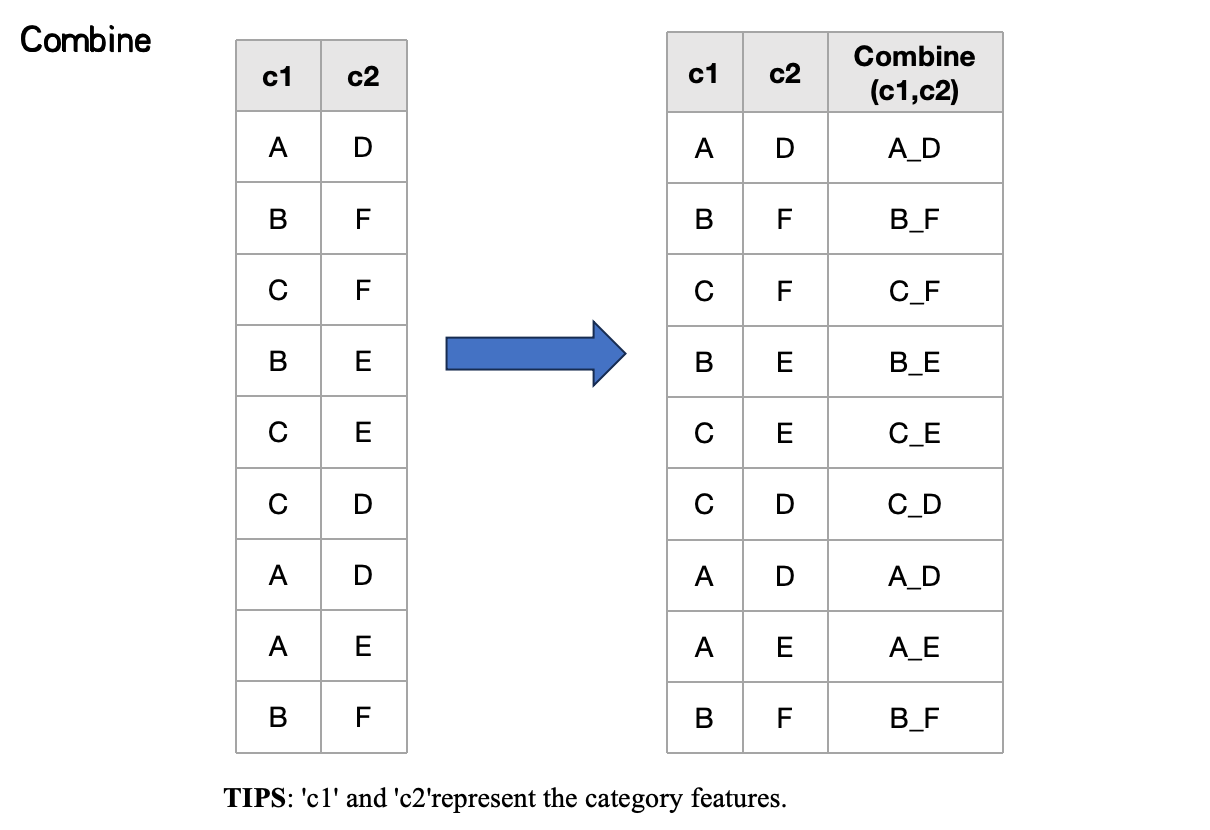
Combine(c1, c2): character combination of featurec1and featurec2. -
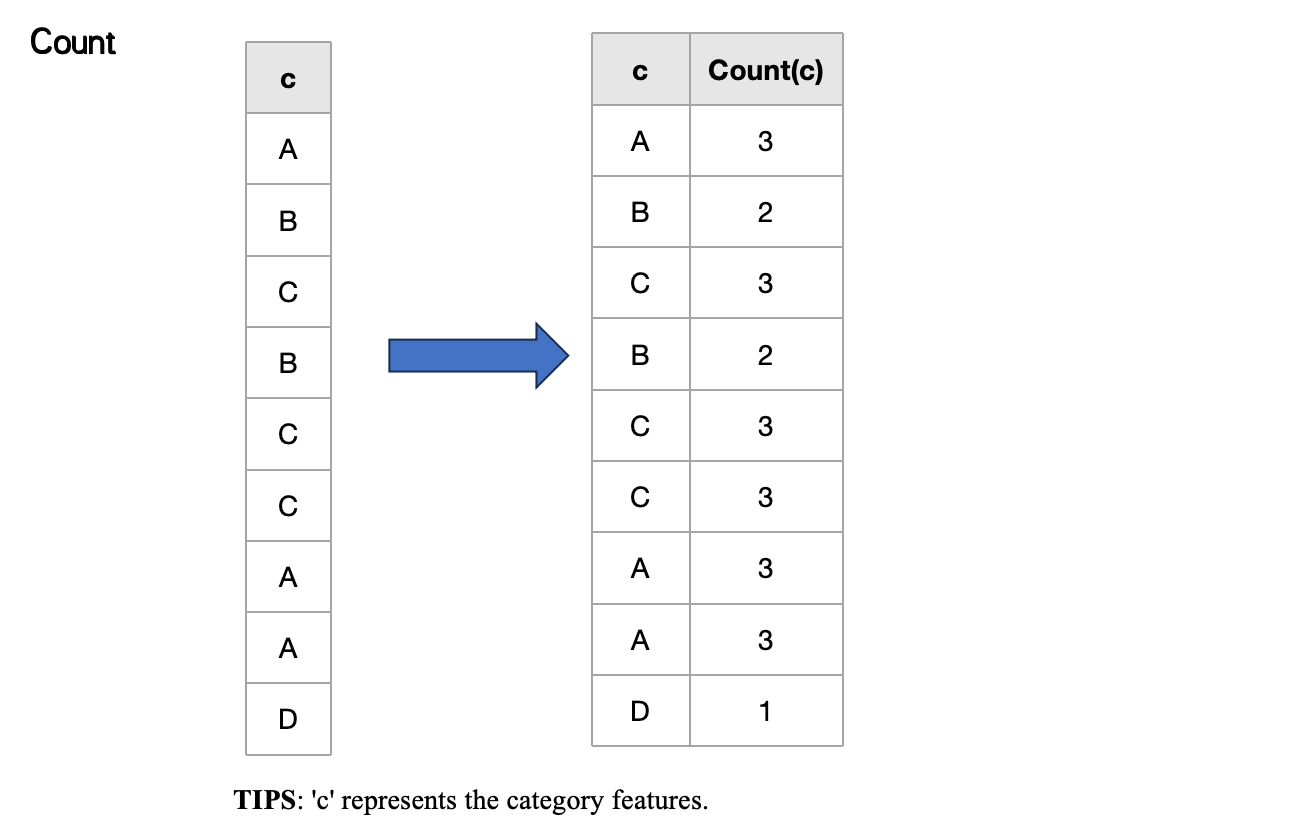
Count(c): count of categories of featurec. -
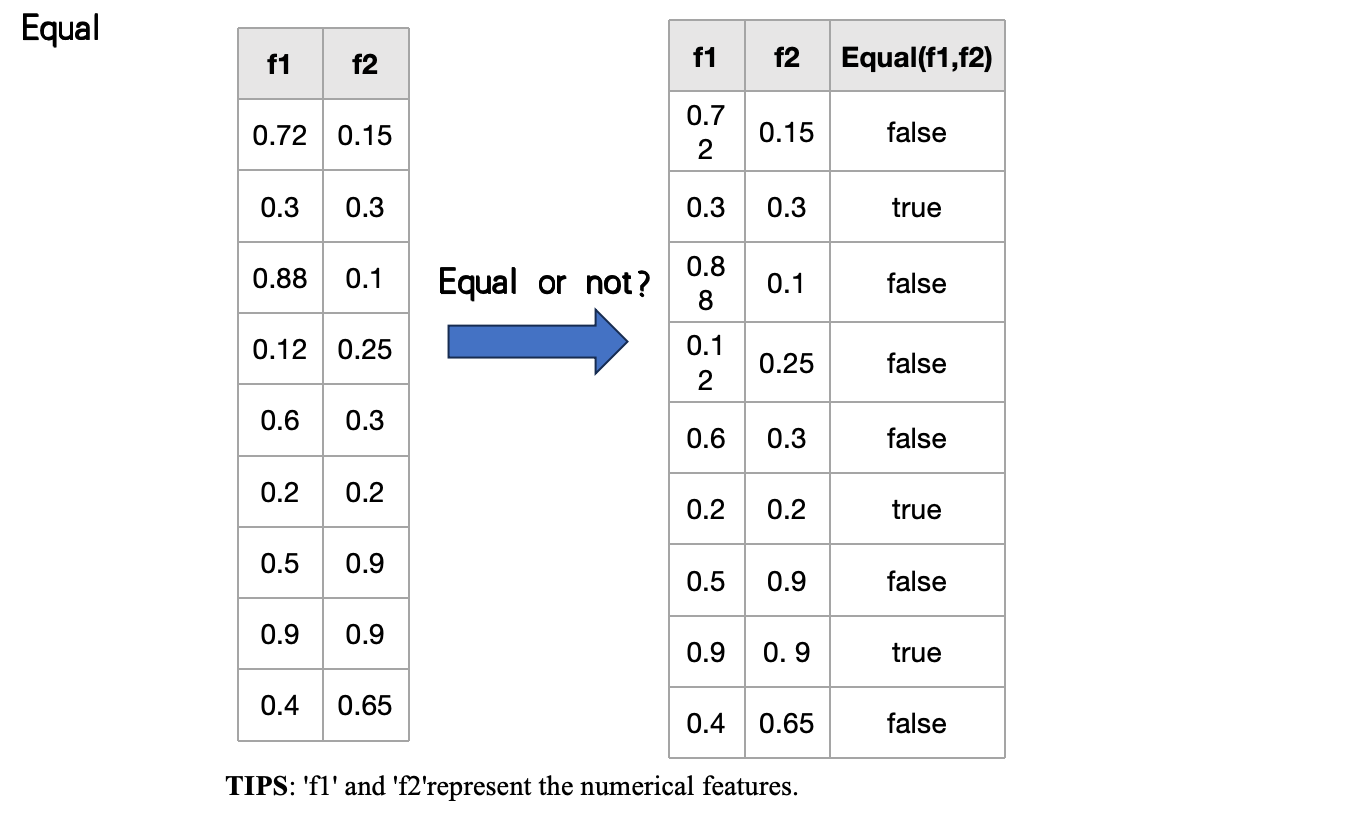
Equal(f1, f2): judge whether featuref1and featuref2are equal. -
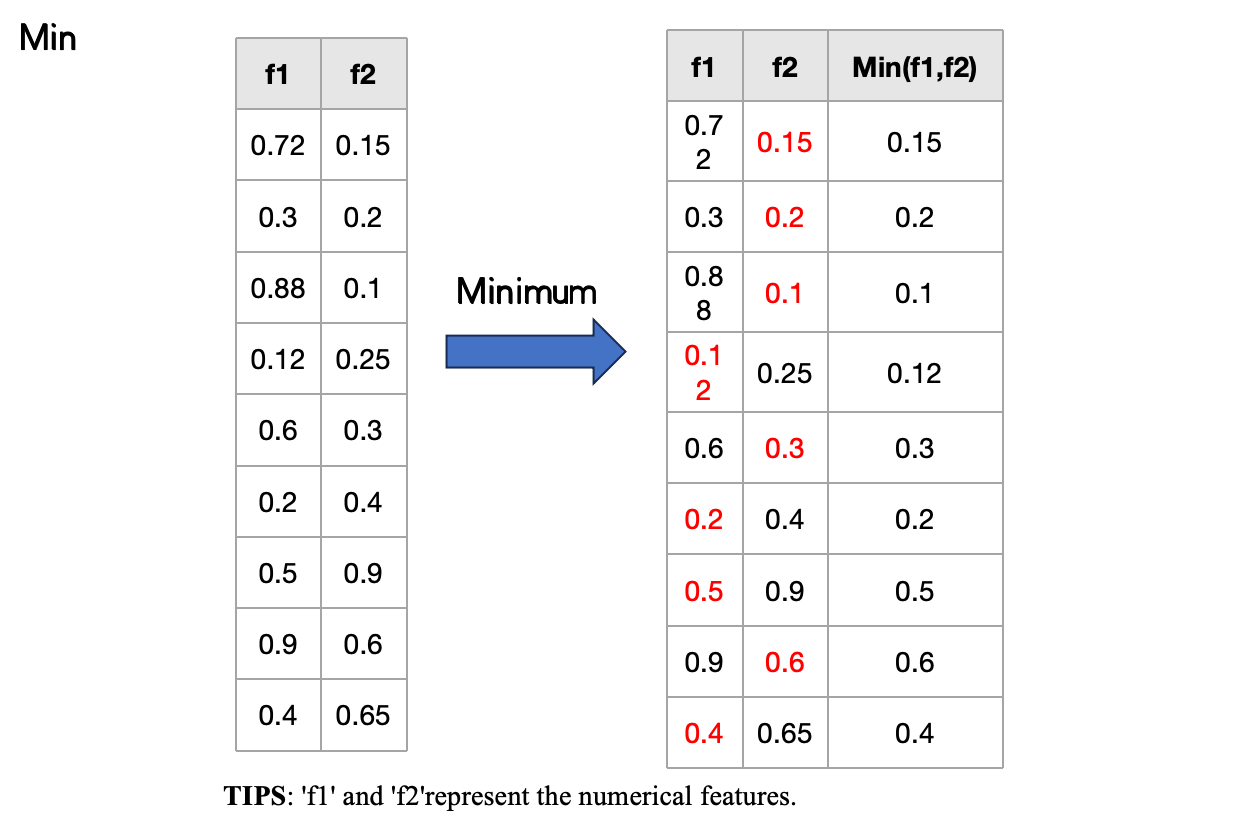
Min(f1, f2): take the smaller value of featuref1compared to featuref2. -
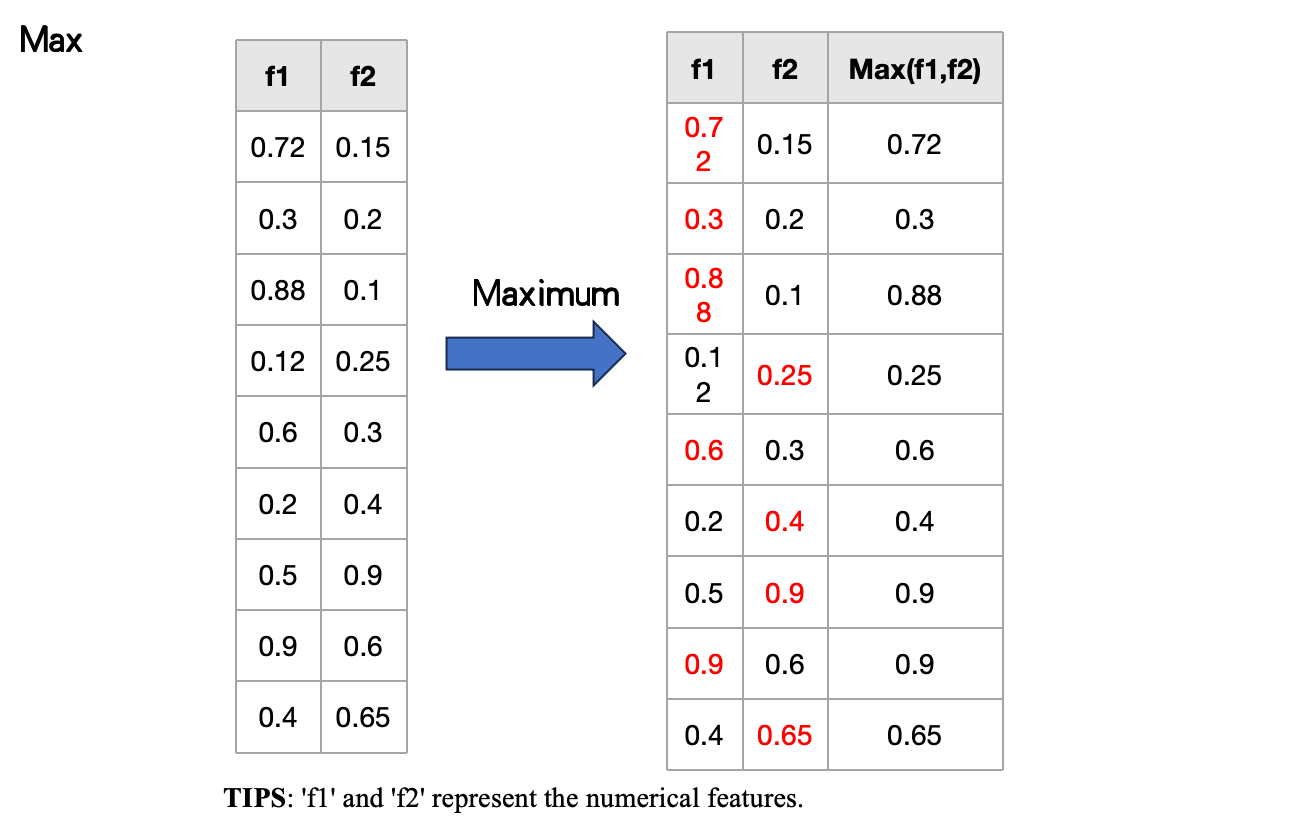
Max(f1, f2): take the larger value of featuref1compared with featuref2. -
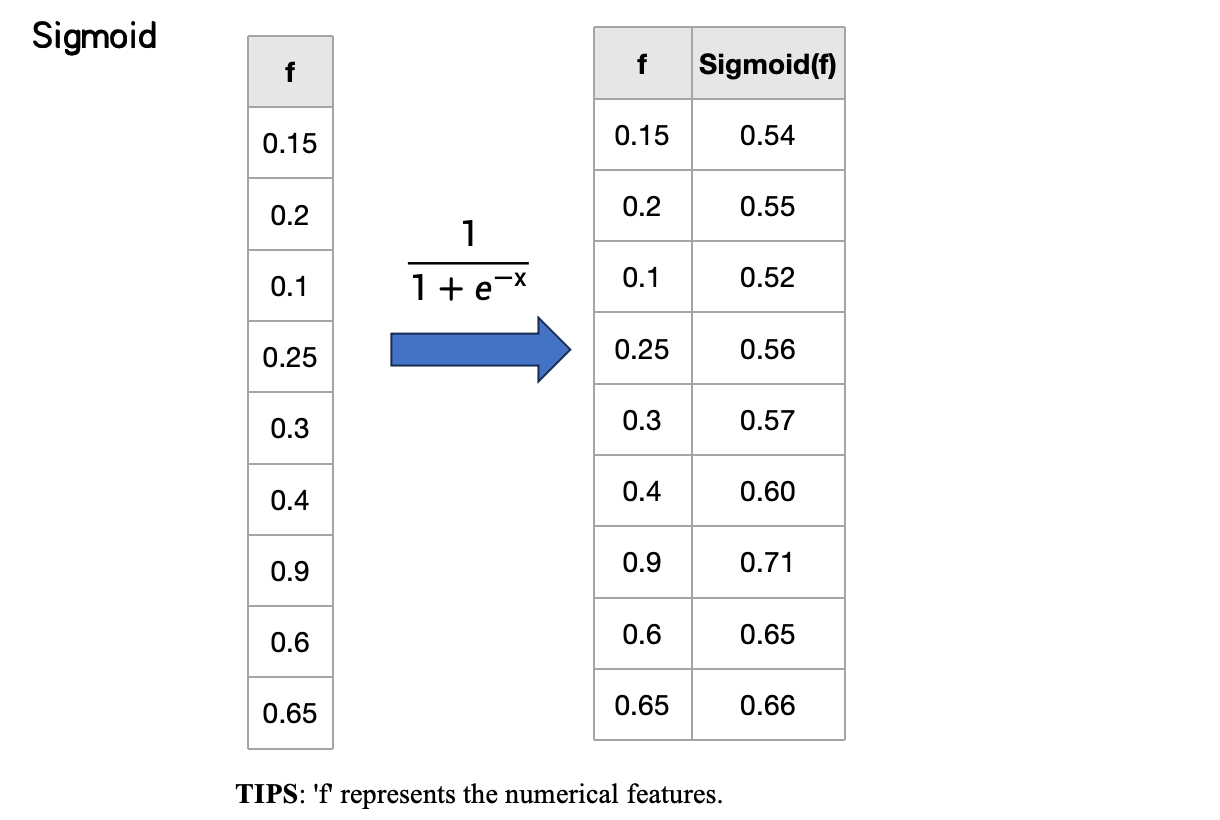
Sigmoid(f):sigmoidnonlinear transformation of featuref. -
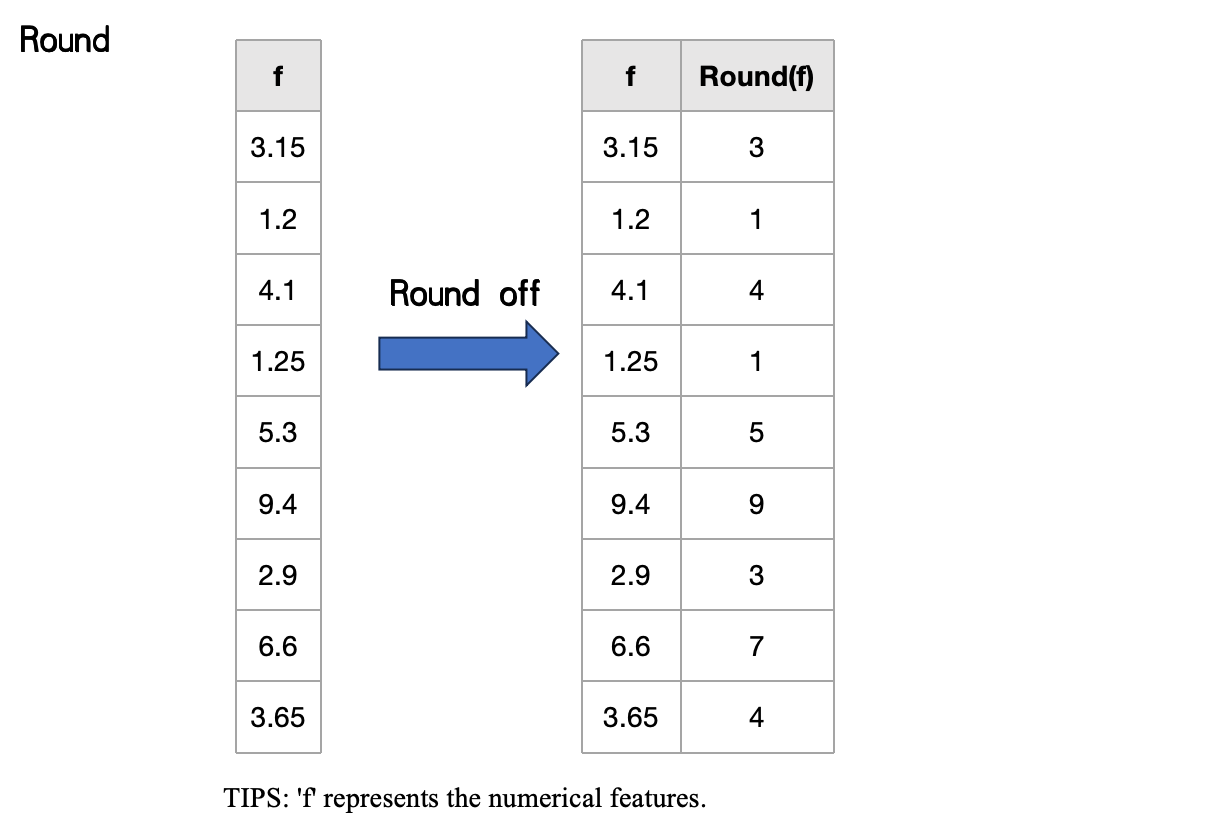
Round(f): rounding featuref. -
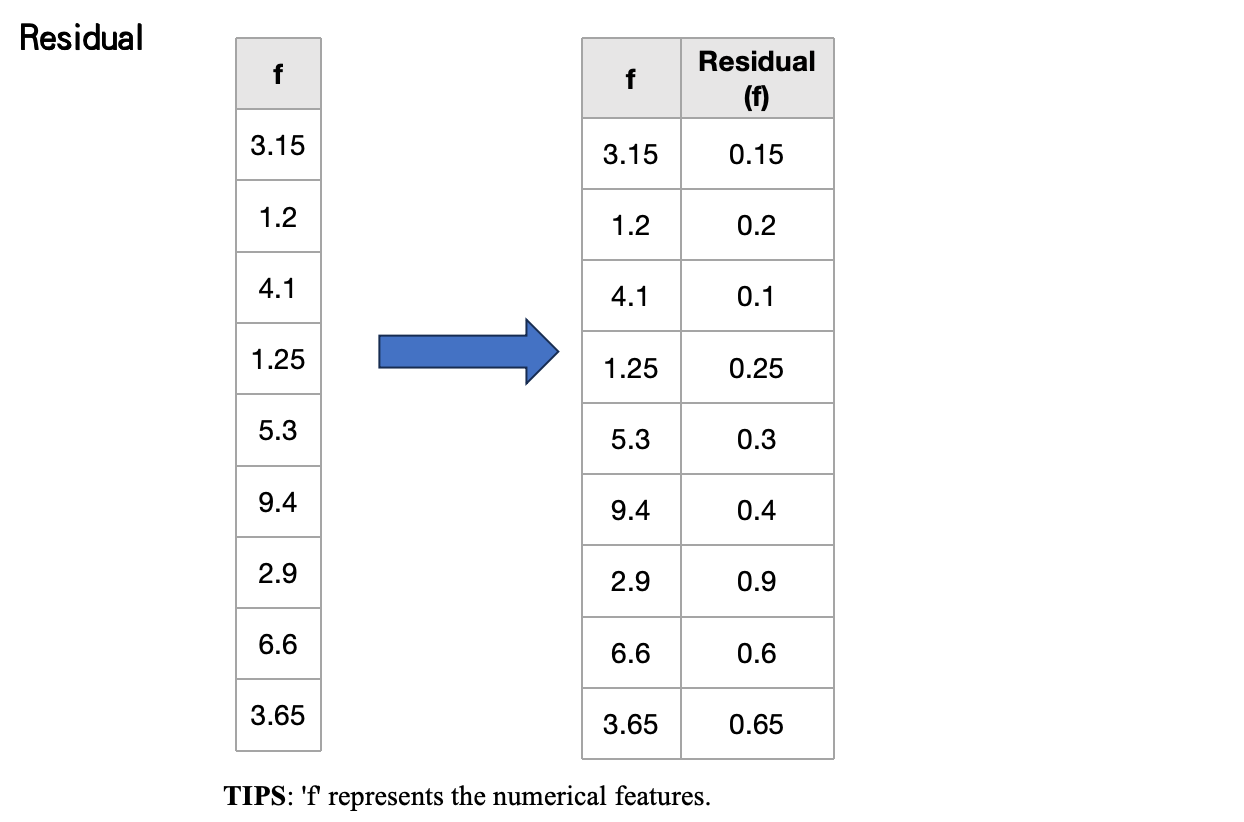
Residual(f): retain the characteristicfto find the number after the decimal point. -
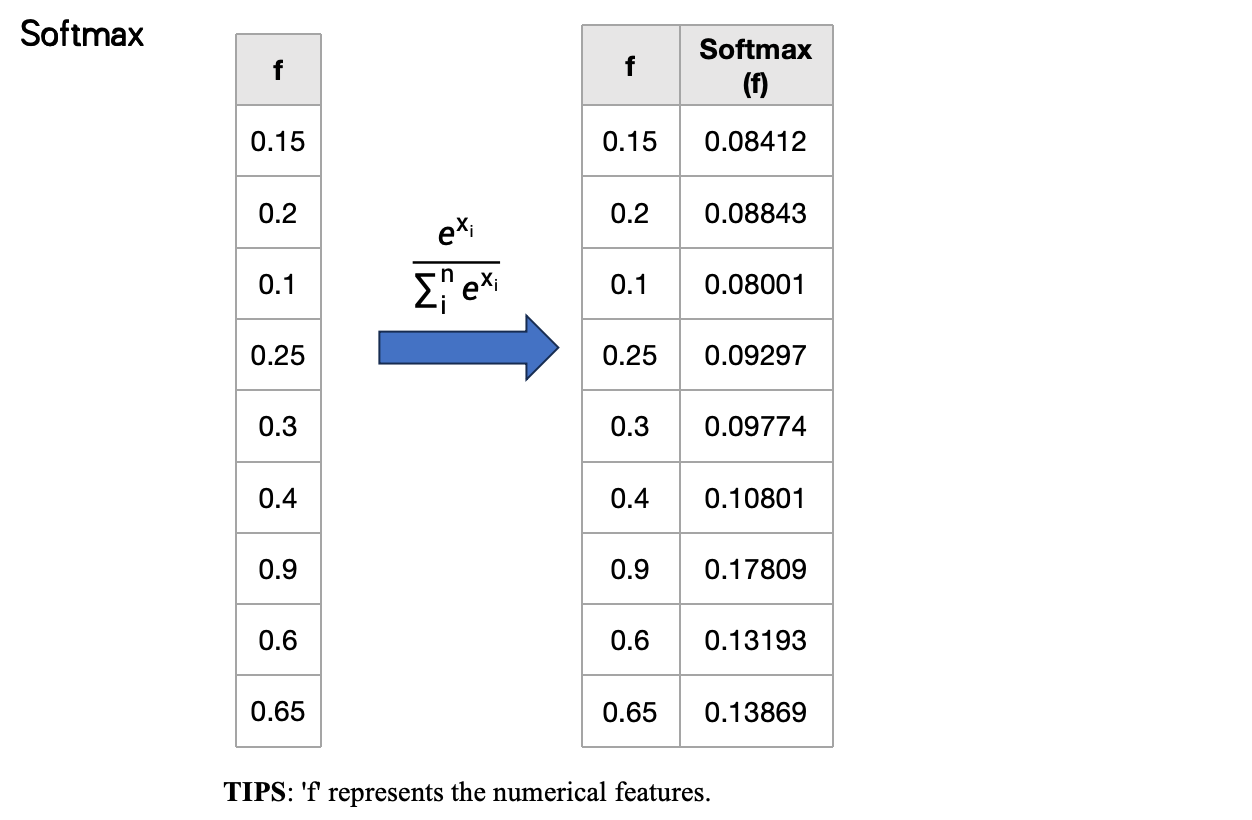
Softmax(f): gradient logarithmic normalization of discrete probability distribution of finite terms. -
Crossrank(f, c): The sort offin each category of featurec. -
Bigger(f1, f2): Whether the featuref1is greater than the featuref2. -
Smaller(f1, f2): Whether the featuref1is less than the featuref2. -
Log(f): Perform operation on the featuref. -
Sin(f): Perform operation on the featuref. -
Cosine(f): Perform operation on the featuref.
Time Series Operator
f represents the numerical feature, and w represents the number of windows.
-
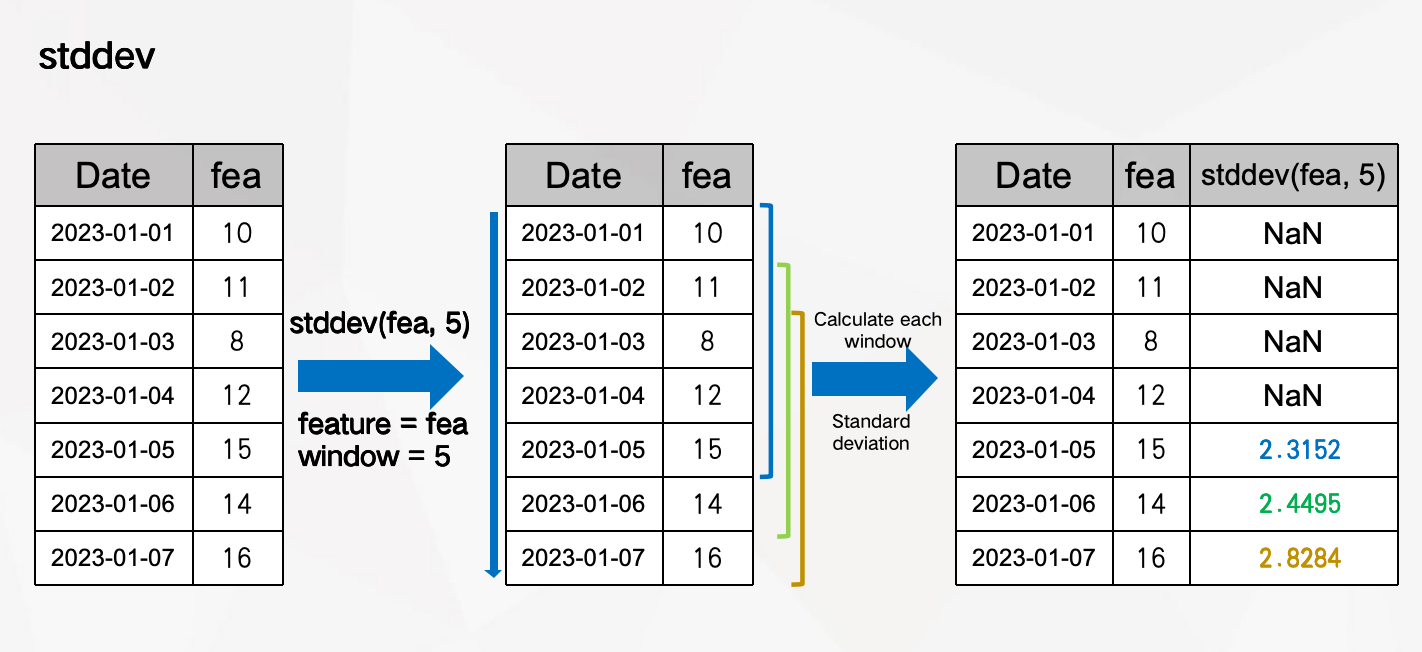
stddev(f, w): calculate the standard deviation of featurefin the window. -
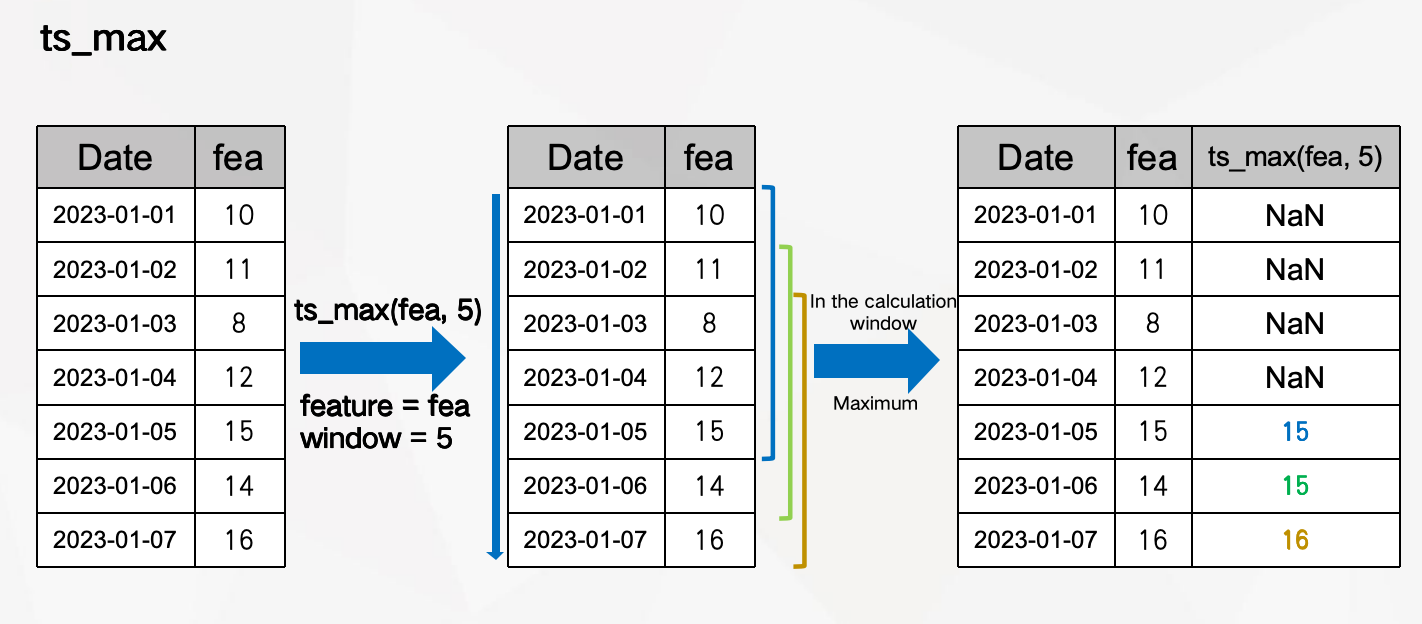
ts_max(f, w): calculates the maximum value of featurefin the window. -
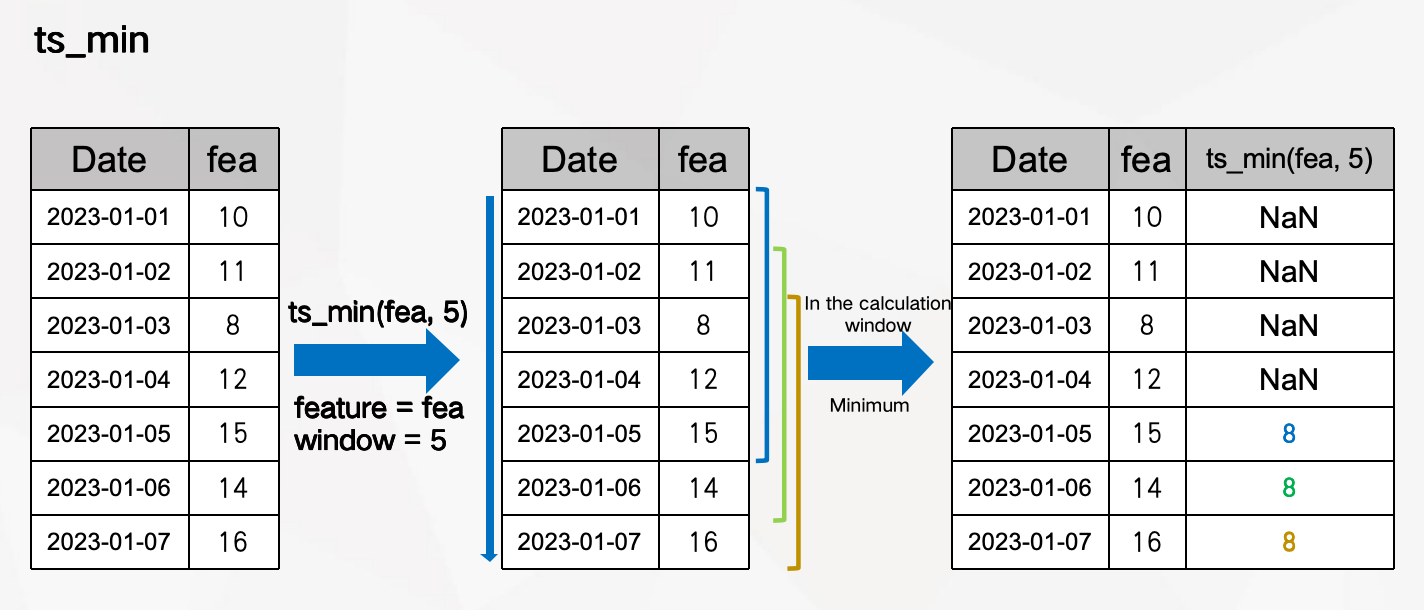
ts_min(f, w): calculates the minimum value of featurefin the window. -
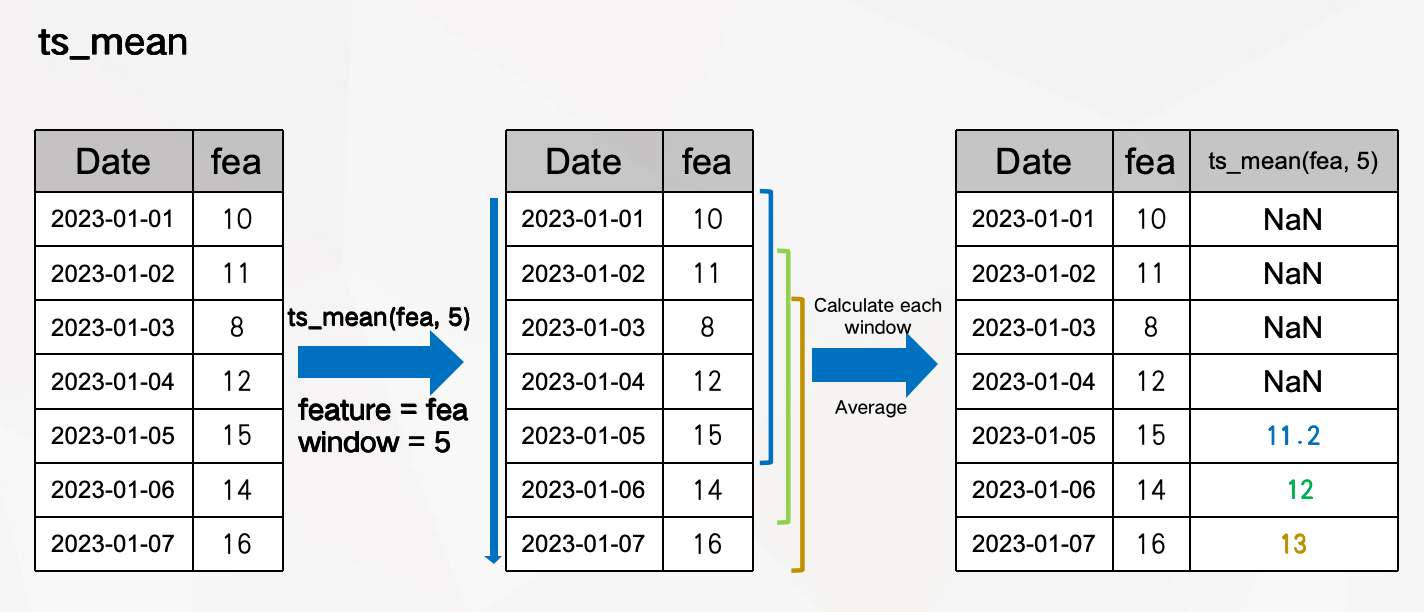
ts_mean(f, w): calculate the average value of featurefin the window. -
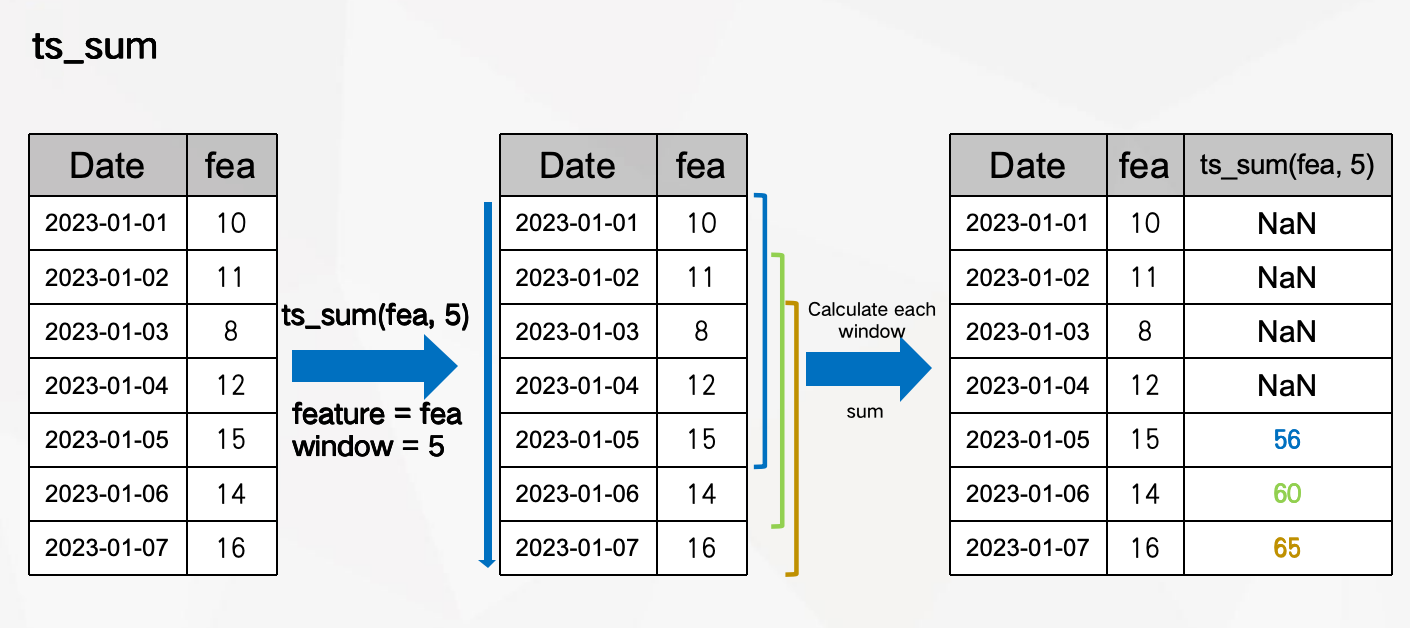
ts_sum(f, w): calculates the summation of featurefin the window. -
ts_rank(f, w): calculates the ranking of the current value of featurefin the window (descending). -
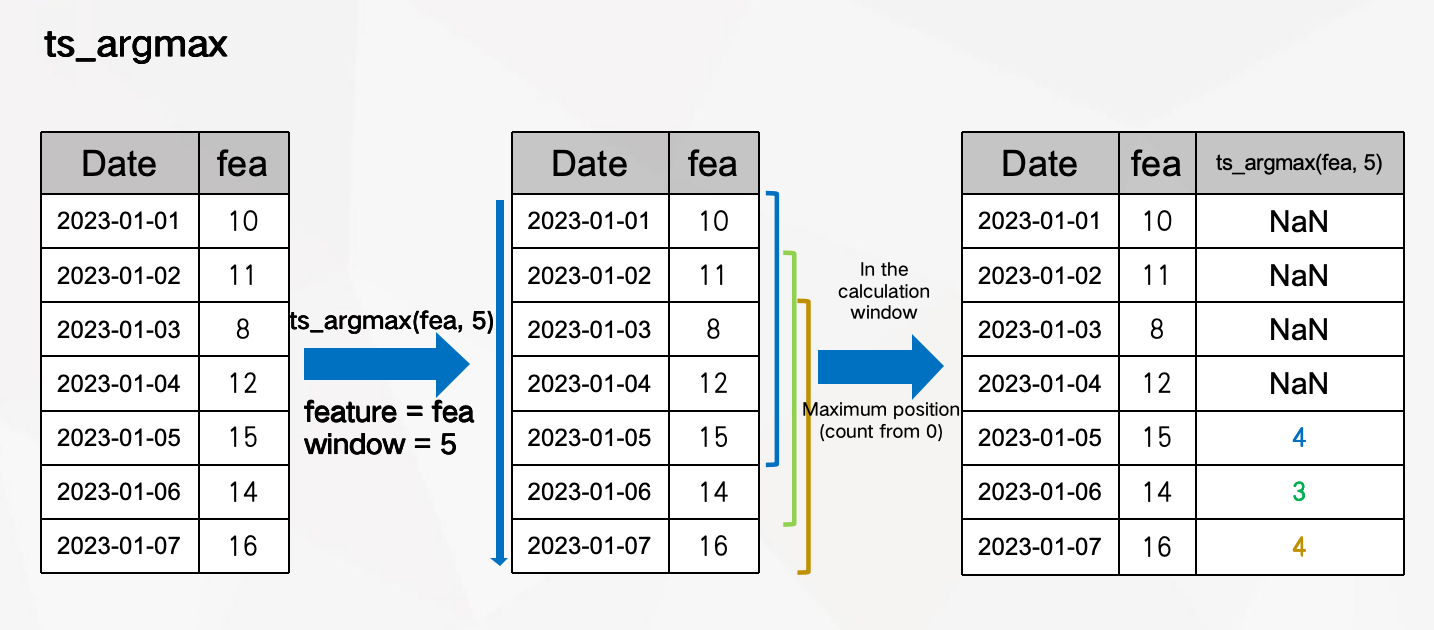
ts_argmax(f, w): calculates the location index of the maximum value of featurefin the window (counted from 0). -
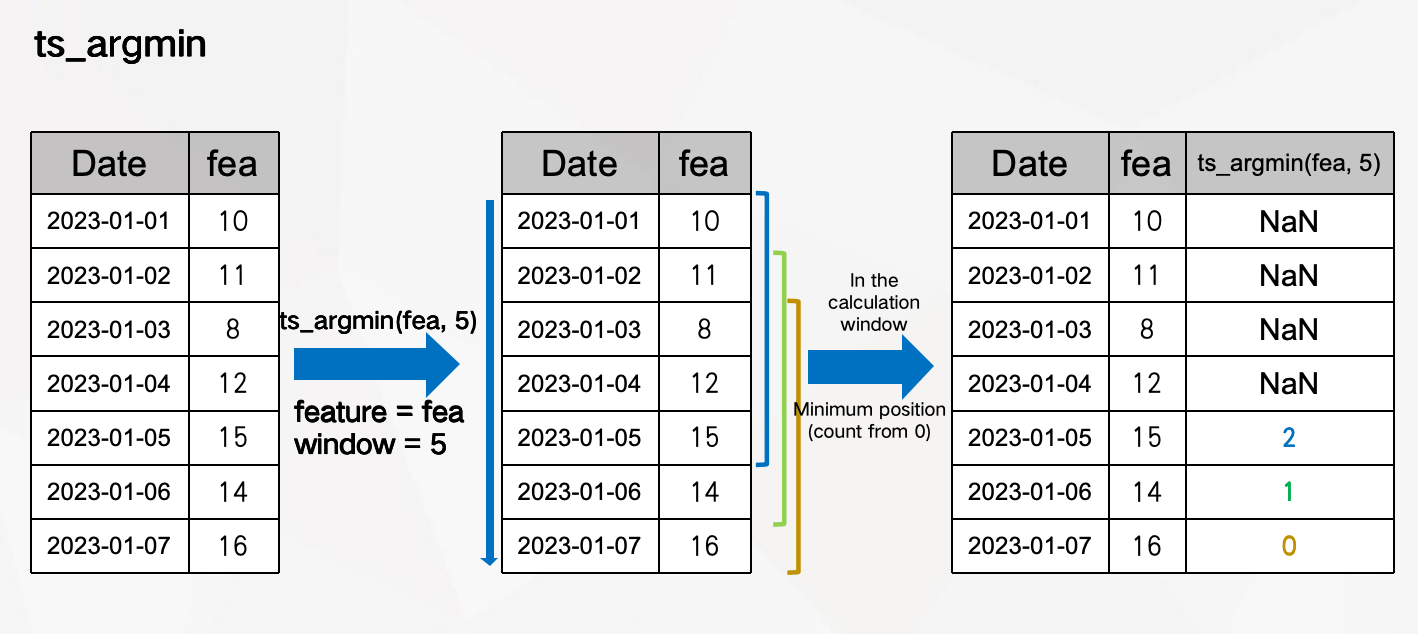
ts_argmin(f, w): calculates the location index of the minimum value of featurefin the window (counted from 0). -
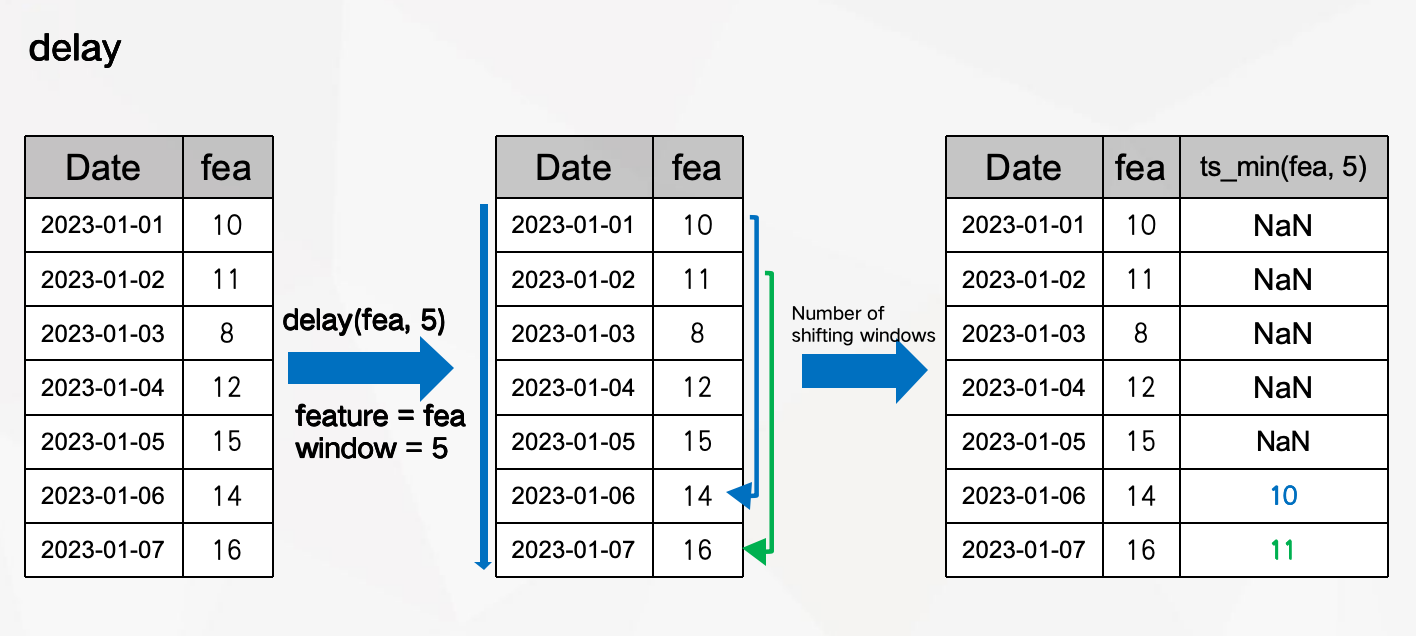
delay(f, w): gets the value corresponding to the earliest time of featurefin the window. -
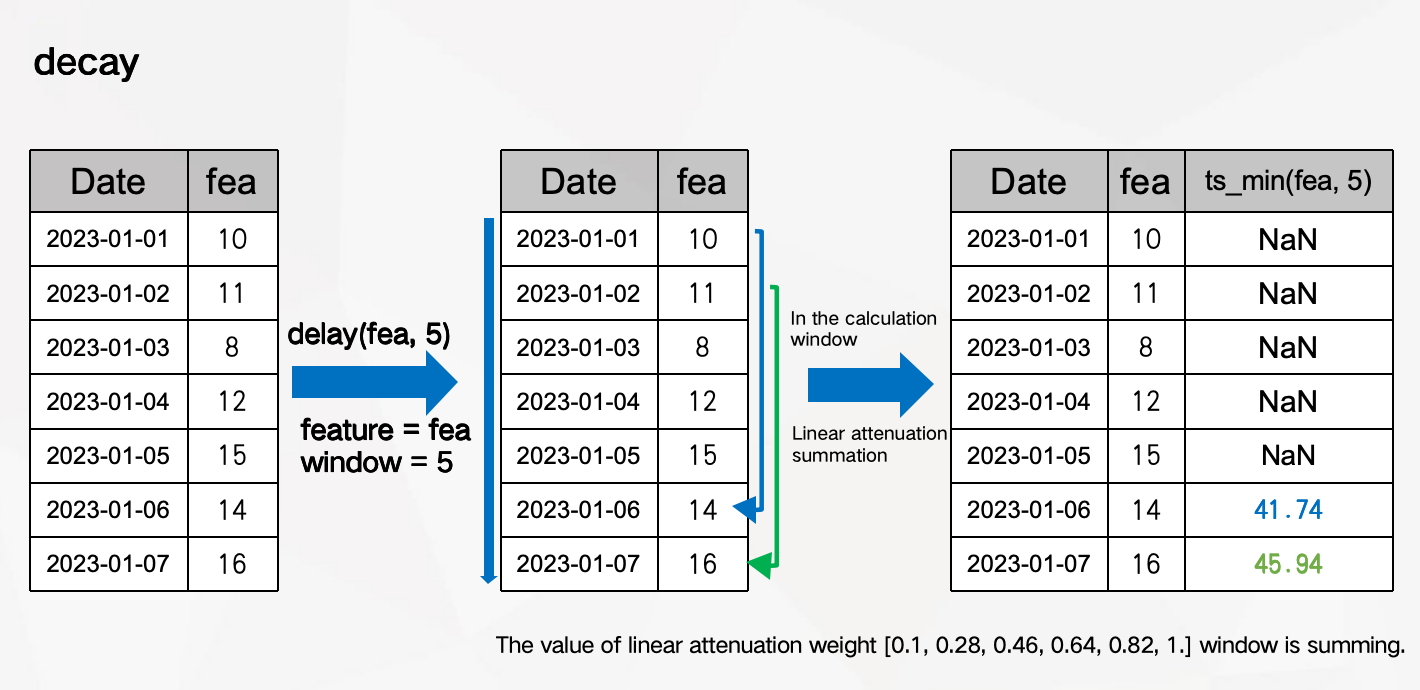
decay(f, w): calculate the linear attenuation sum of characteristicfin the window.。 -
delta(f, w): calculates the difference between the latest and earliest values of featurefin the window. -
correlation(f1, f2, w): calculate the correlation coefficient between featuref1and featuref2in the window. -
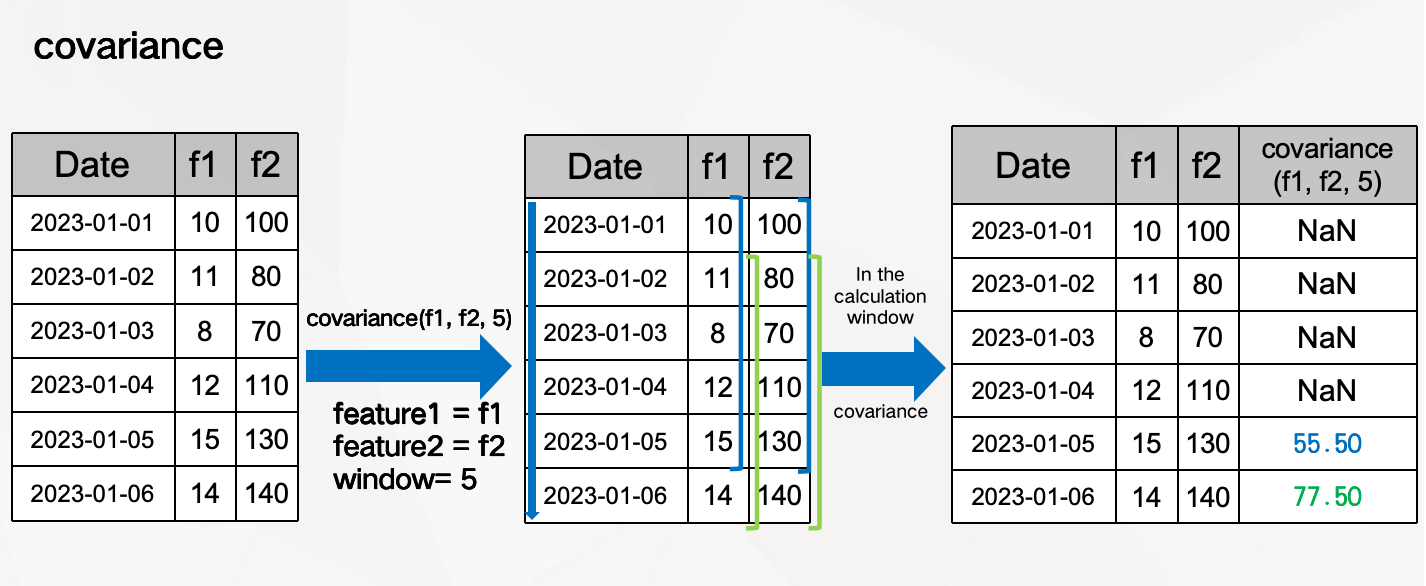
covariance(f1, f2, w): calculate the covariance of featuref1and featuref2in the window.
Operator Diagram
AggMin(f, c)
Represents the minimum value of f in all categories of feature c.
AggMax(f, c)
Represents the maximum value of f in all categories of feature c.
AggMean(f, c)
Represents the average value of f in all categories of feature c.
AggMedian(f, c)
Represents the median of f in all categories of feature c.
AggVar(f, c)
Represents the variance of f in each category of characteristic c.
CrossCount([c1, c2, ..])
According to the count of characteristic list aggregates, the list length is greater than or equal to 2.
Nunique(c1, c2)
Represents the count of unique values of c1 in feature c2 categories.
Entropy(c)
Represents the entropy of each category of feature c.
Percentile(f)
Represents the percentile of each data of feature f.
Combine(c1, c2)
Represents the character combination of feature c1 and feature c2.
Count(c)
Count of categories of feature c.
Equal(f1, f2)
Judge whether feature f1 and feature f2 are equal.
Min(f1, f2)
Take the smaller value of feature f1 compared with feature f2.
Max(f1, f2)
Take the larger value of feature f1 compared with feature f2.
Sigmoid(f)
Sigmoid nonlinear transformation of feature f.
Round(f)
Rounding feature f.
Residual(f)
Retain the characteristic f to calculate the value after the decimal point.
Softmax(f)
Gradient logarithmic normalization of discrete probability distribution of finite terms.
stddev(f, w)
Calculate the standard deviation of feature f in the window.
ts_max(f, w)
Calculate the maximum value of feature f in the window.
ts_min(f, w)
Calculate the minimum value of feature f in the window.
ts_mean(f, w)
Calculate the average value of feature f in the window.
ts_sum(f, w)
Calculate the sum of feature f in the window.
ts_rank(f, w)
Calculate the ranking of the current value of feature f in the window (descending).
ts_argmax(f, w)
Calculate the location index of the maximum value of feature f in the window (counted from 0).
ts_argmin(f, w)
Calculate the minimum location index of feature f in the window (count from 0).
delay(f, w)
Get the value corresponding to the earliest time of feature f in the window.
decay(f, w)
Calculate the linear attenuation sum of characteristic f in the window.
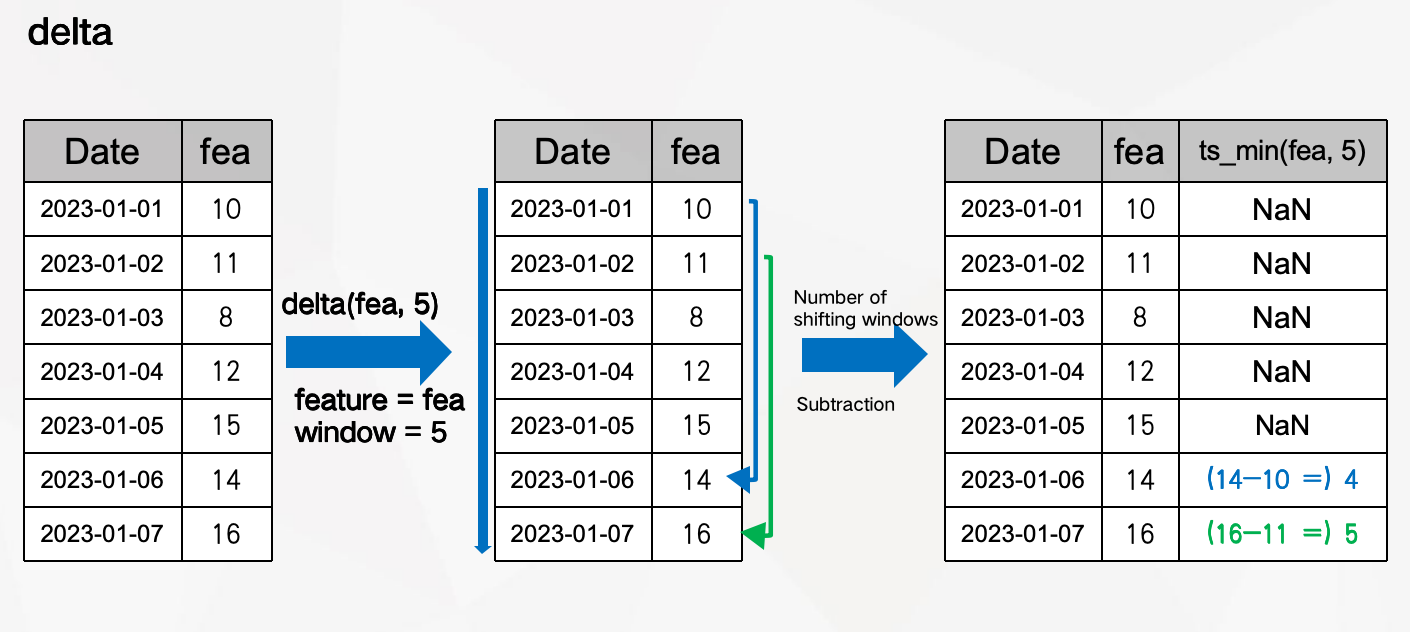
delta(f, w)
Calculate the difference between the latest and earliest values of feature f in the window.
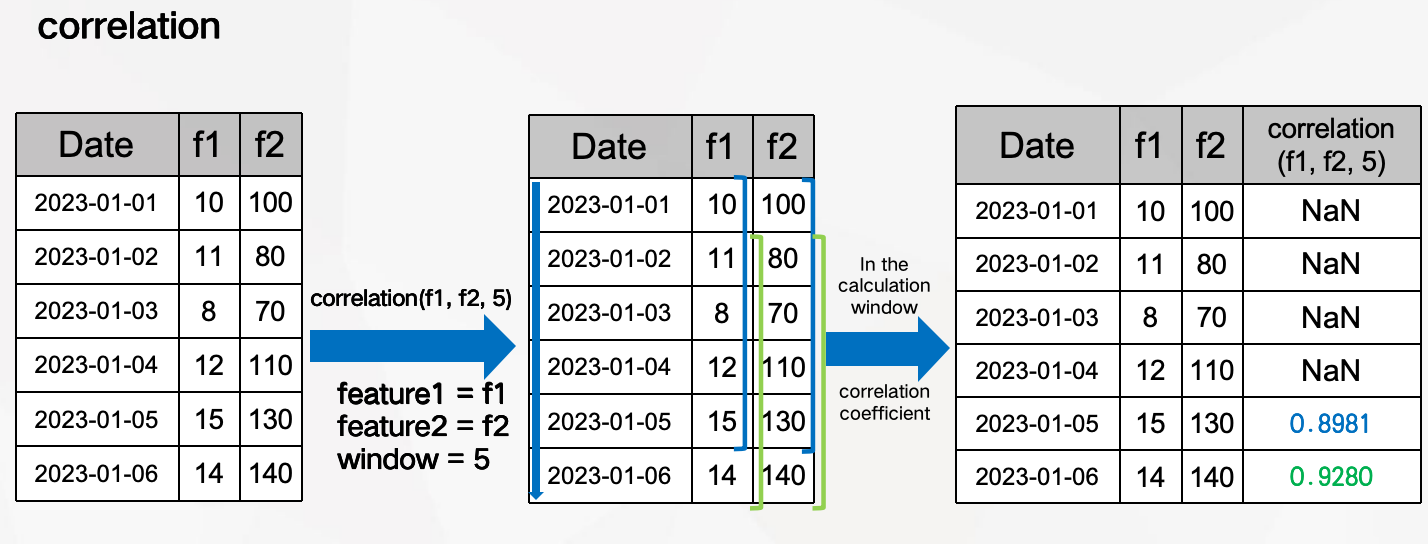
correlation(f1, f2, w)
Calculate the correlation coefficient between feature f1 and feature f2 in the window.
covariance(f1, f2, w)
Calculate the covariance of feature f1 and feature f2 in the window.